> For the complete documentation index, see [llms.txt](https://support.ninchat.com/ninchat-support/llms.txt). Markdown versions of documentation pages are available by appending `.md` to page URLs; this page is available as [Markdown](https://support.ninchat.com/ninchat-support/english-new/user-interface/queue-management/queue-statistics.md).

# Queue statistics

\
Viewing statistics requires operator rights within the organization. Navigate to the customer queue statistics:

**From the queue dropdown menu:**\
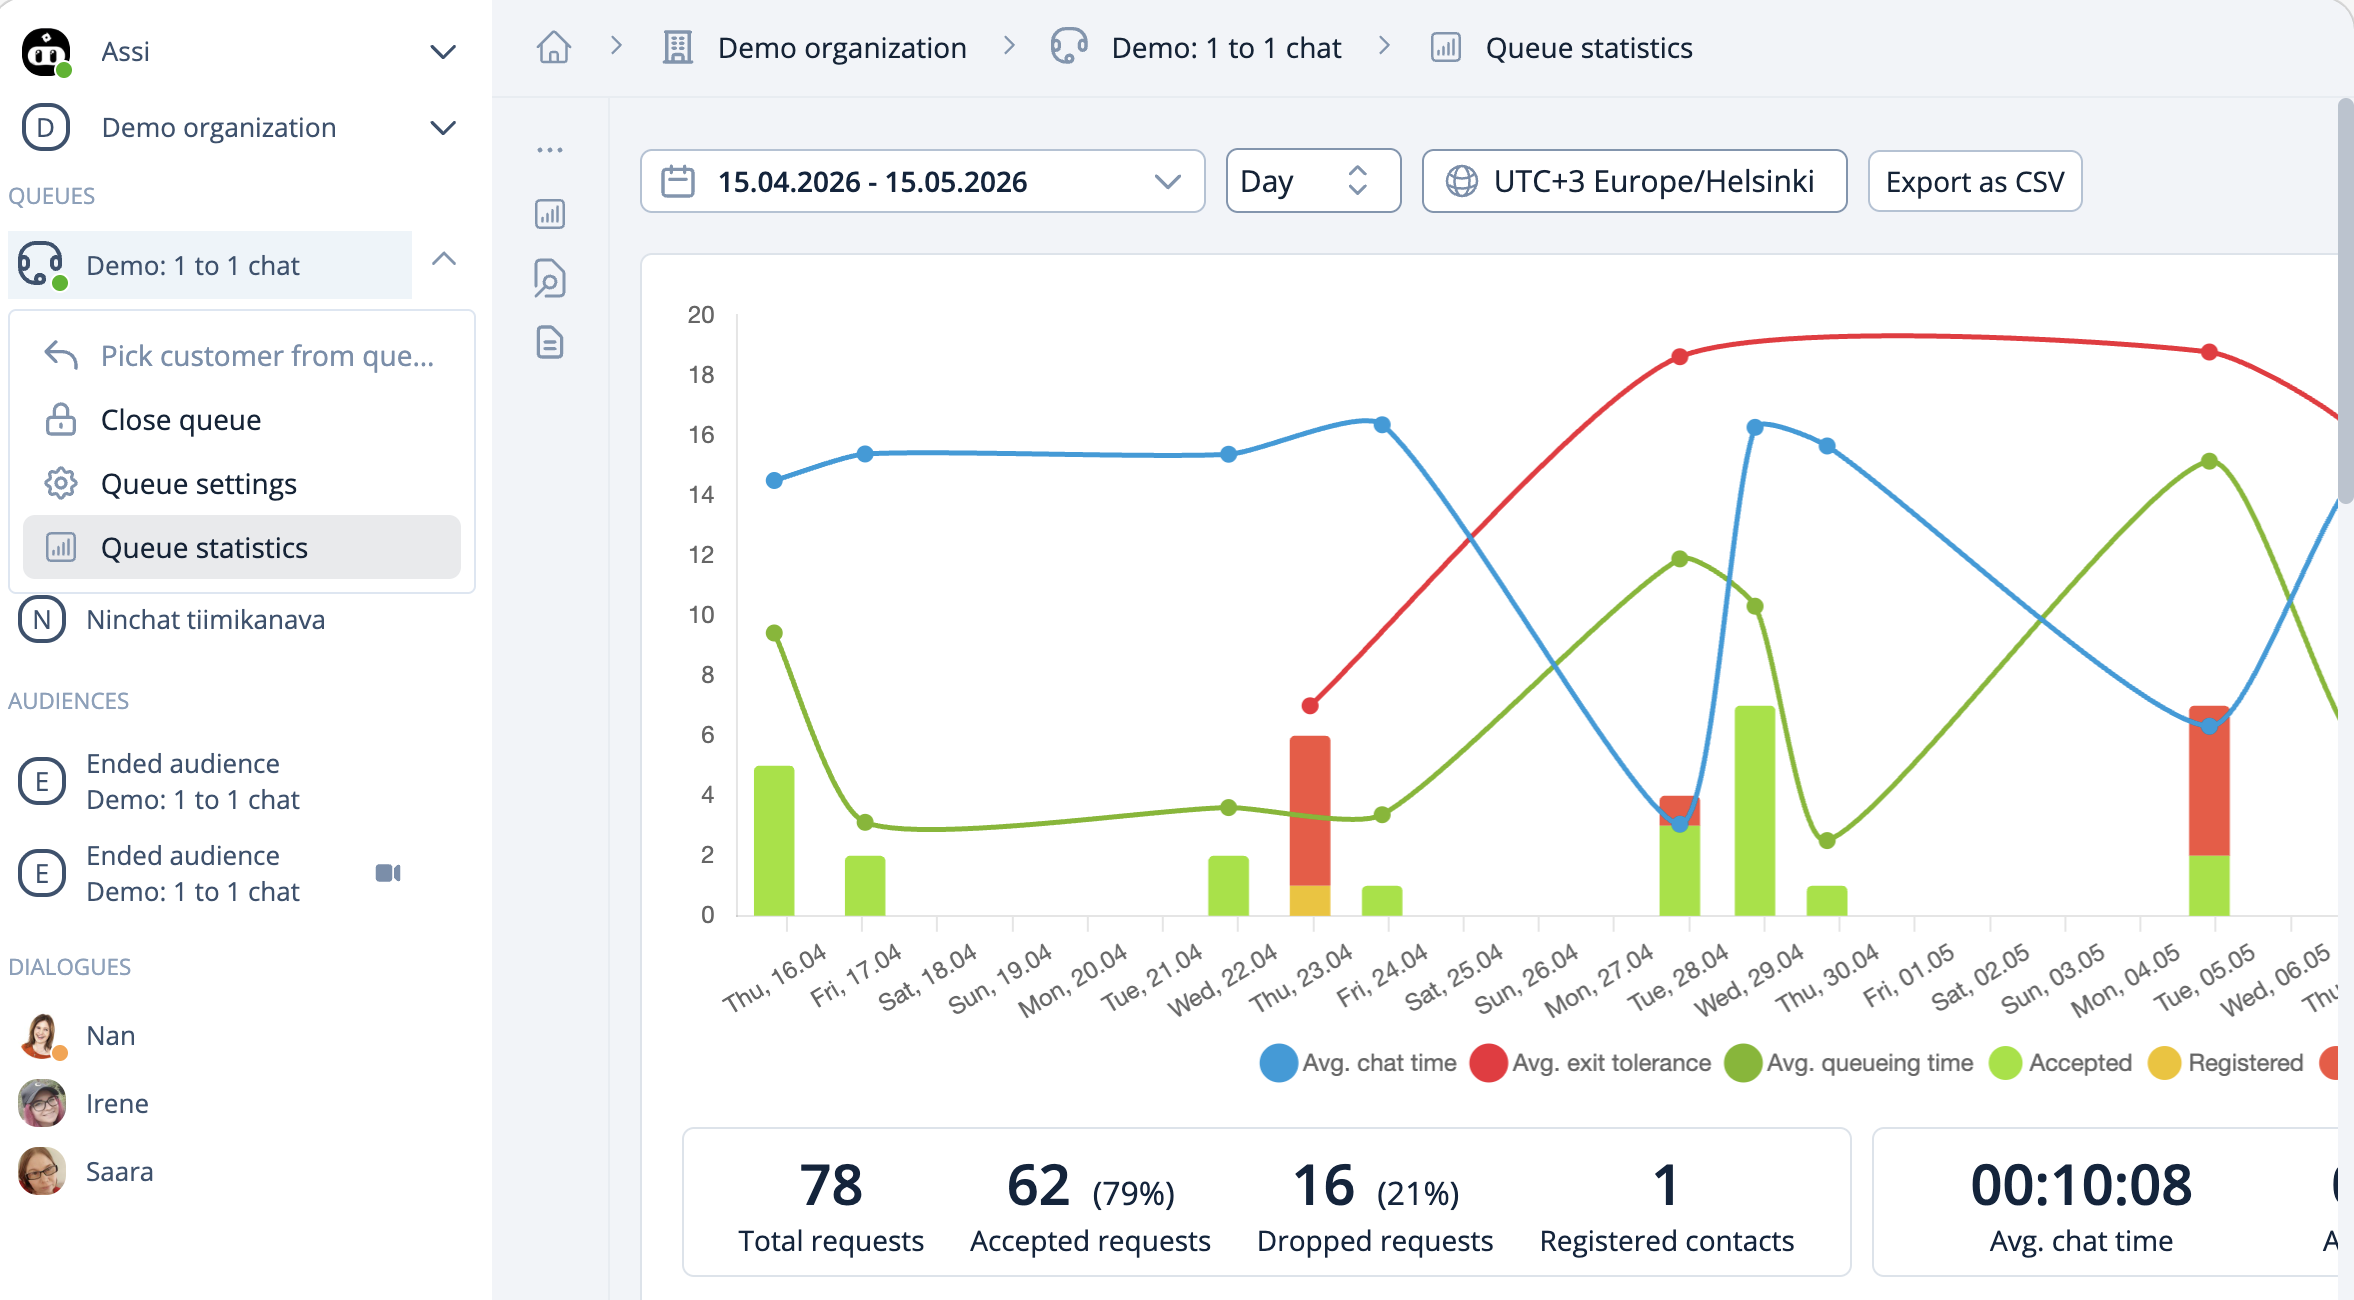
Click the arrow icon next to the queue name in the left sidebar and select **Queue statistics**. (for queues where you have been added as a handler)

**From the organization main view:**\
You can access statistics for all organization queues from the organization settings under **Queues**.

<br>

## Opening the Statistics page

Viewing statistics requires operator rights within the organization. Navigate to the queue statistics:

{% stepper %}
{% step %}

### **From the queue dropdown menu:**

Click the arrow icon next to the queue name in the left sidebar and select Queue statistics. (for queues where you have been added as a handler)
{% endstep %}

{% step %}

### **From the organization main view:**

You can access statistics for all organization queues from the organization dashboard by opening the Queues view.
{% endstep %}
{% endstepper %}

<div data-with-frame="true"><figure><img src="https://498815019-files.gitbook.io/~/files/v0/b/gitbook-x-prod.appspot.com/o/spaces%2FIeqTSbNtGOeWTiig2G5l%2Fuploads%2Fgit-blob-705563699f28dc749b0b570127a0cdaeb0e53879%2Fimage.png?alt=media" alt=""><figcaption><p>Opening the Queue statistics page from the sidebar or the organization dashboard .</p></figcaption></figure></div>

### Features

You can view conversation history, tags, user satisfaction, survey responses, and metadata. Statistics are updated almost in real time, at the latest within one hour. Customer service representatives can add tags for six hours after a conversation ends, so statistics may be updated during that period.

Statistics and conversation histories can be downloaded manually as CSV files or automatically exported to the customer's CRM system (contact us for more information).

**The Statistics page is divided into:**

* Time-range and review-period selections, including history and survey options
* Graphical charts
* Tag-specific statistics
* Customer service representative statistics
* Daily statistics and conversation reviews

#### **Features**

You can view chat history, tags, user satisfaction, survey responses, and metadata. Statistics are updated almost in real-time, refreshing at the latest within an hour. Customer service representatives can add tags up to six hours after a conversation ends, meaning these updates occur within that timeframe.

Statistics and chat histories can be manually downloaded and saved as a CSV file, or they can be automatically exported to the customer's CRM system (contact us for more information).

**The Statistics page is divided into sections:**

* Time range and review period selections, as well as history and survey options
* Graphical charts
* Tag-specific statistics
* Customer service representative-specific statistics
* Daily statistics and conversation reviews

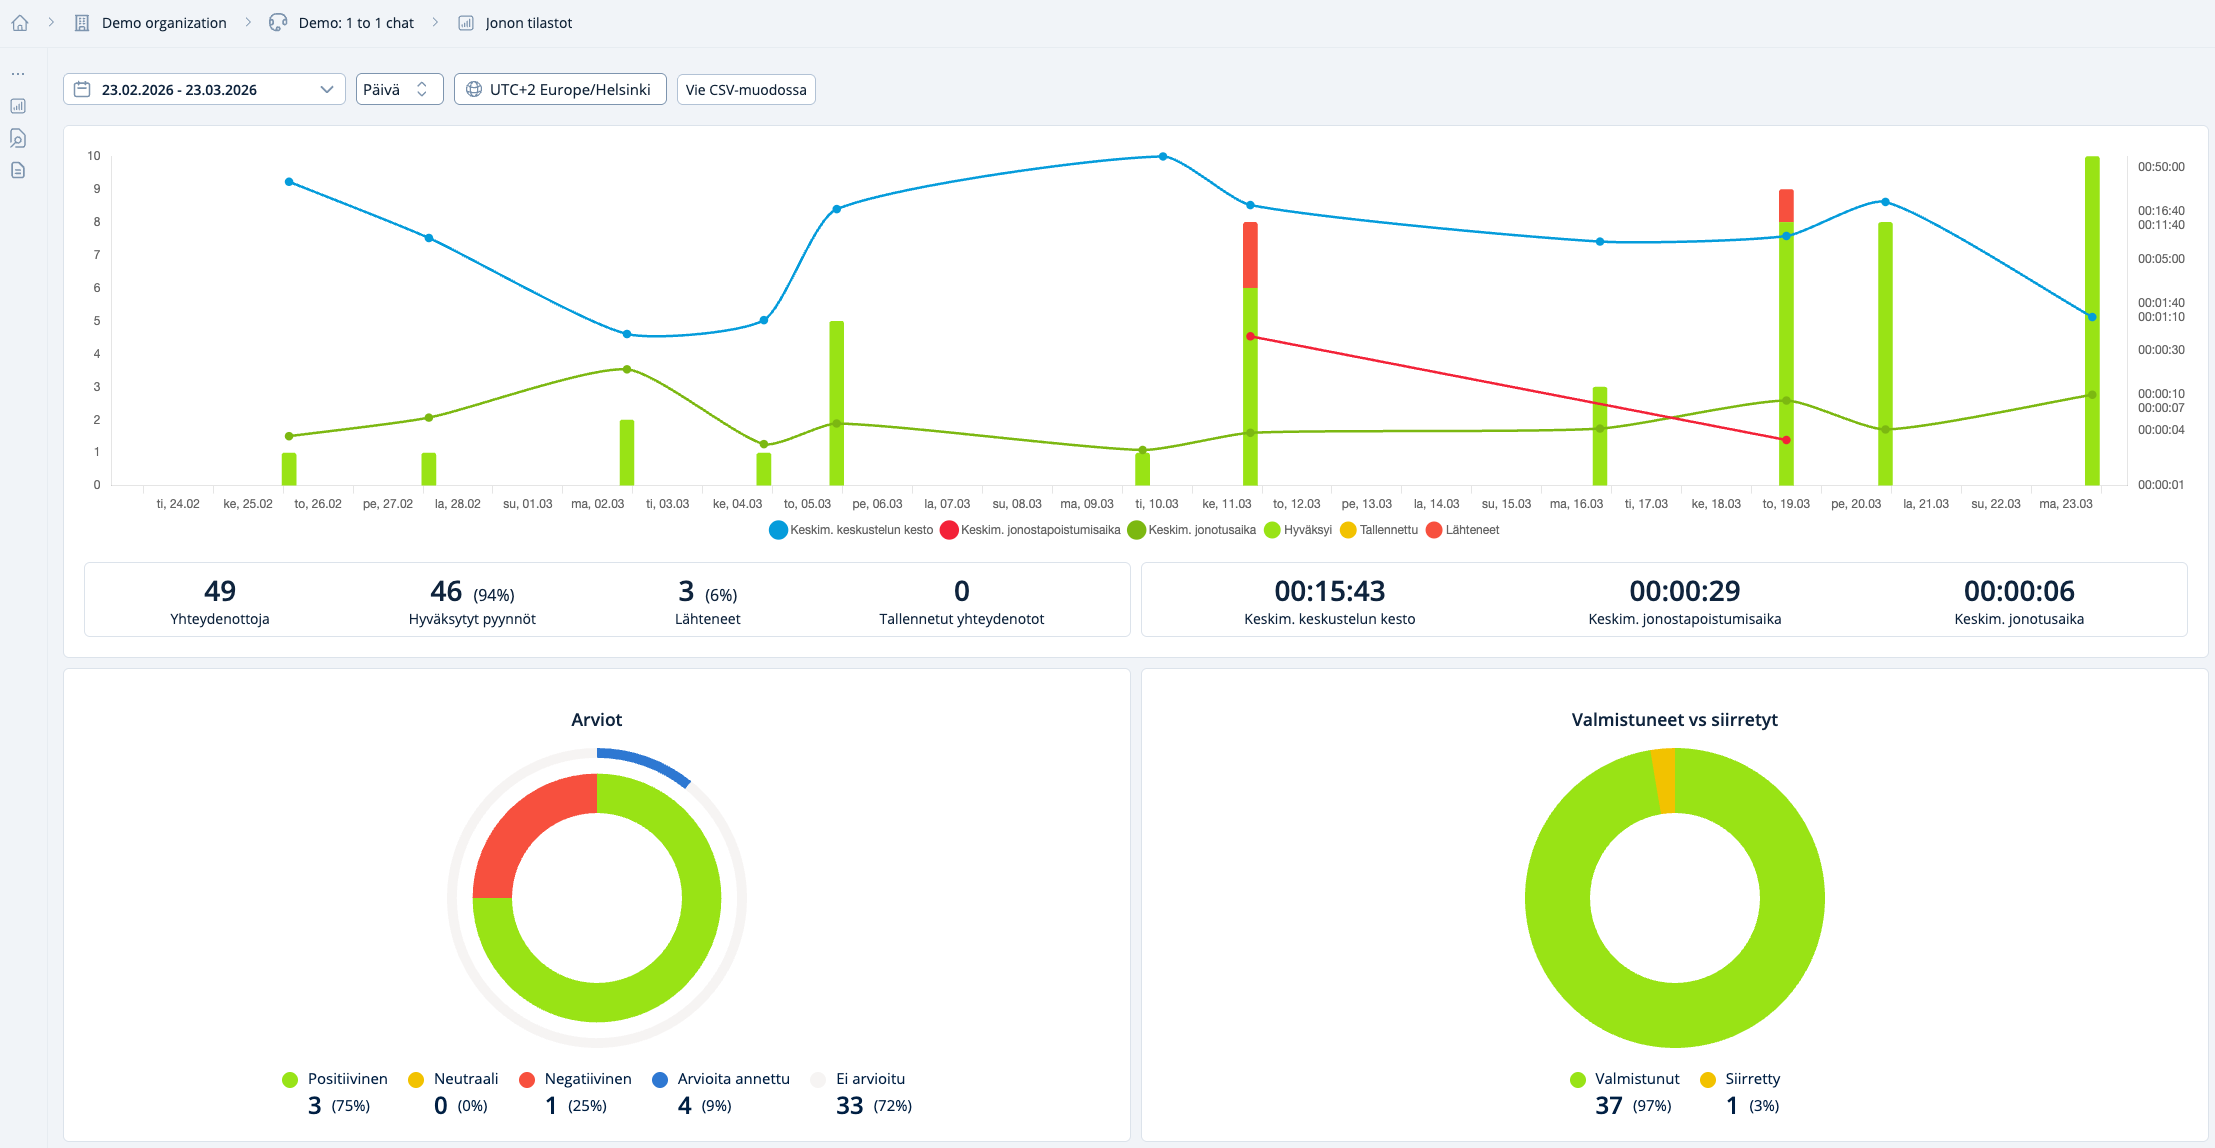
### **Graphical Charts**

The charts provide a quick overview of activities. You can examine:

* The number of conversations
* The number of picked and dropped participants
* The number of registered contacts
* Average times for conversations, queuing, and leaving the queue
* Feedback and the number of responses

A customer's arrival to the queue is referred to as a request:

* Accepted request: A customer service representative picks the customer from the queue.
* Dropped request: The customer is not picked from the queue.

<div data-with-frame="true"><figure><img src="https://498815019-files.gitbook.io/~/files/v0/b/gitbook-x-prod.appspot.com/o/spaces%2FIeqTSbNtGOeWTiig2G5l%2Fuploads%2Fgit-blob-561b18adfab03621a27659e48e9ddfbf562aa127%2Fimage.png?alt=media" alt=""><figcaption></figcaption></figure></div>

### **Tag-Specific Statistics**

You can review statistics based on tags. This provides insights into which topics or services are popular and consume time in customer service, as well as the type of feedback the topic receives.

<div data-with-frame="true"><figure><img src="https://498815019-files.gitbook.io/~/files/v0/b/gitbook-x-prod.appspot.com/o/spaces%2FIeqTSbNtGOeWTiig2G5l%2Fuploads%2Fgit-blob-49a060227a7b7d4d0d99cdd80d0ea2653f47e4c2%2Fimage.png?alt=media" alt=""><figcaption></figcaption></figure></div>

In certain situations, tags can also be automated.

## Customer service representative statistics

![](https://498815019-files.gitbook.io/~/files/v0/b/gitbook-x-prod.appspot.com/o/spaces%2FIeqTSbNtGOeWTiig2G5l%2Fuploads%2Fgit-blob-48f3891670237af5e18123a56a81157428b5377b%2FAsiakaspalvelijakohtaiset%20tilastot.png?alt=media)

### **Customer service agen-specific statistics**

You can view individual general statistics per agent within a selected time period. The average rating ranges between -1 and 1 if the customer interface utilizes the standard feedback view.

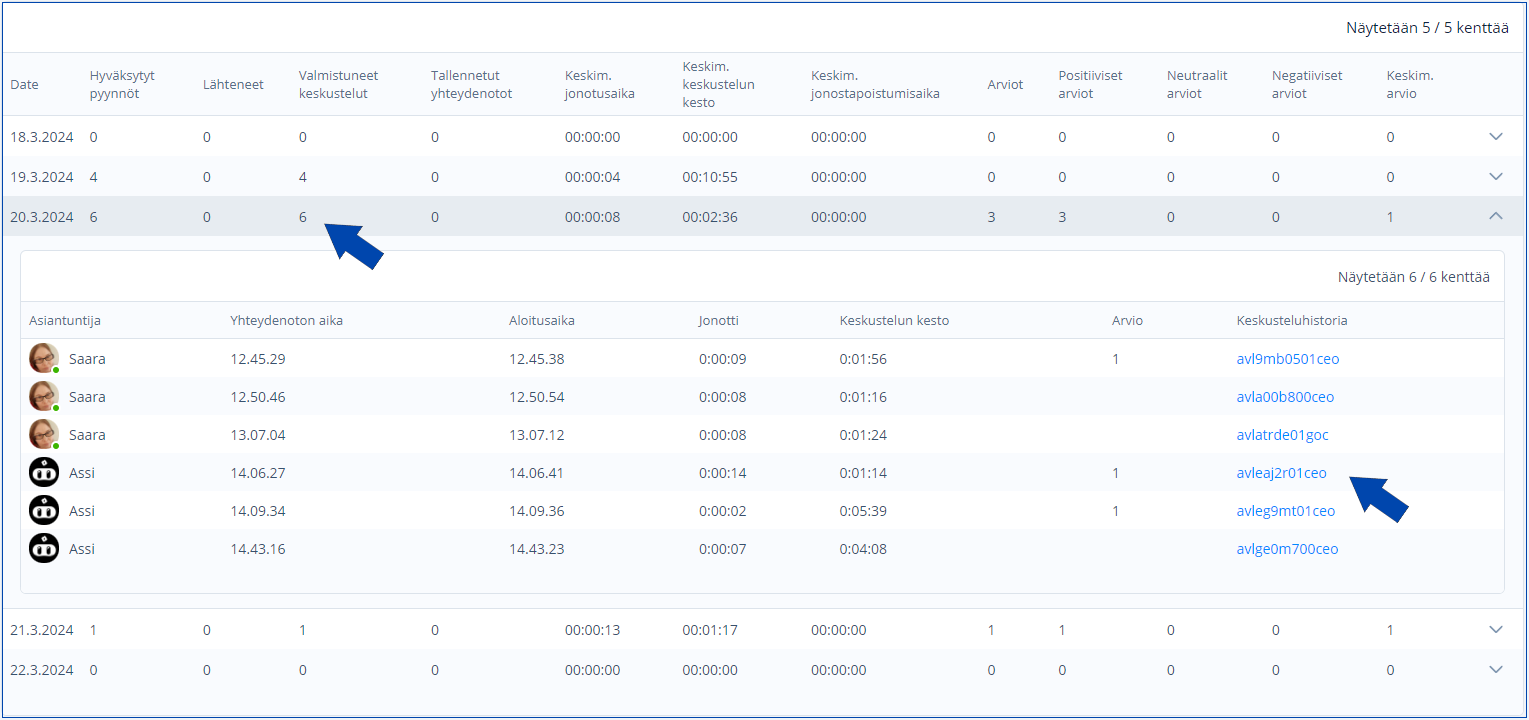
### **Daily Statistics**

<figure><img src="https://498815019-files.gitbook.io/~/files/v0/b/gitbook-x-prod.appspot.com/o/spaces%2FIeqTSbNtGOeWTiig2G5l%2Fuploads%2Fgit-blob-d1d33ef9e878cd8074a90e415f9ef1278acf249c%2FP%C3%A4iv%C3%A4kohtaiset%20tilastot.png?alt=media" alt=""><figcaption></figcaption></figure>

From daily statistics, you can view the conversations content and access conversation logs.

Click on the three-dot menu of a specific date row to open the conversations for that day. By clicking the conversation link, a modal will opan and you can read the details of the selected conversation.

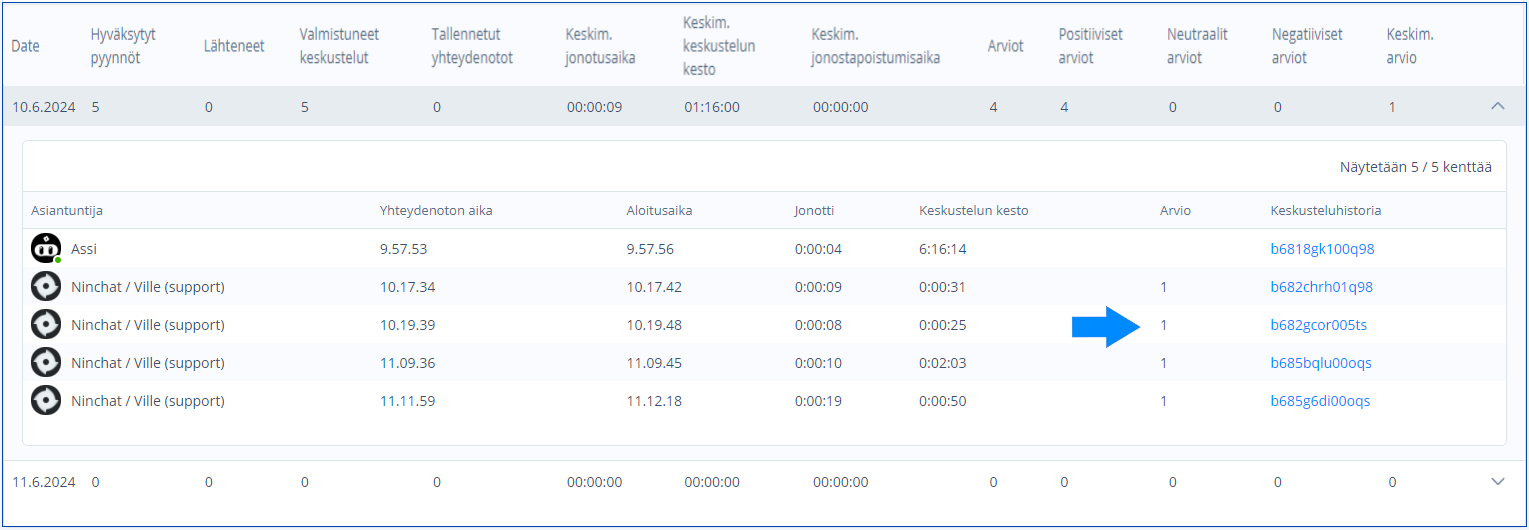
<figure><img src="https://498815019-files.gitbook.io/~/files/v0/b/gitbook-x-prod.appspot.com/o/spaces%2FIeqTSbNtGOeWTiig2G5l%2Fuploads%2Fgit-blob-df5d55005b7ce6f4c216247ea0b45dd317a08bb7%2FP%C3%A4ivitt%C3%A4iset%20tilastot_Hymi%C3%B6t.png?alt=media" alt=""><figcaption><p>Customer feedback number in the Rating column.</p></figcaption></figure>

The customer’s rating of the conversation quality is displayed as a number in the statistics.

The customer selects an appropriate option from emoji icons they see.\
If your organization is using Ninchat's post questionnaire instead of the three emojis, you can review the feedback under the section Metadata & Questionnaire answers.

{% hint style="info" icon="face-frown" %}
Negative feedback may not always feel pleasant, but it is often the most valuable. By reviewing the conversation that triggered negative feedback, you can easily identify the root of the issue.
{% endhint %}

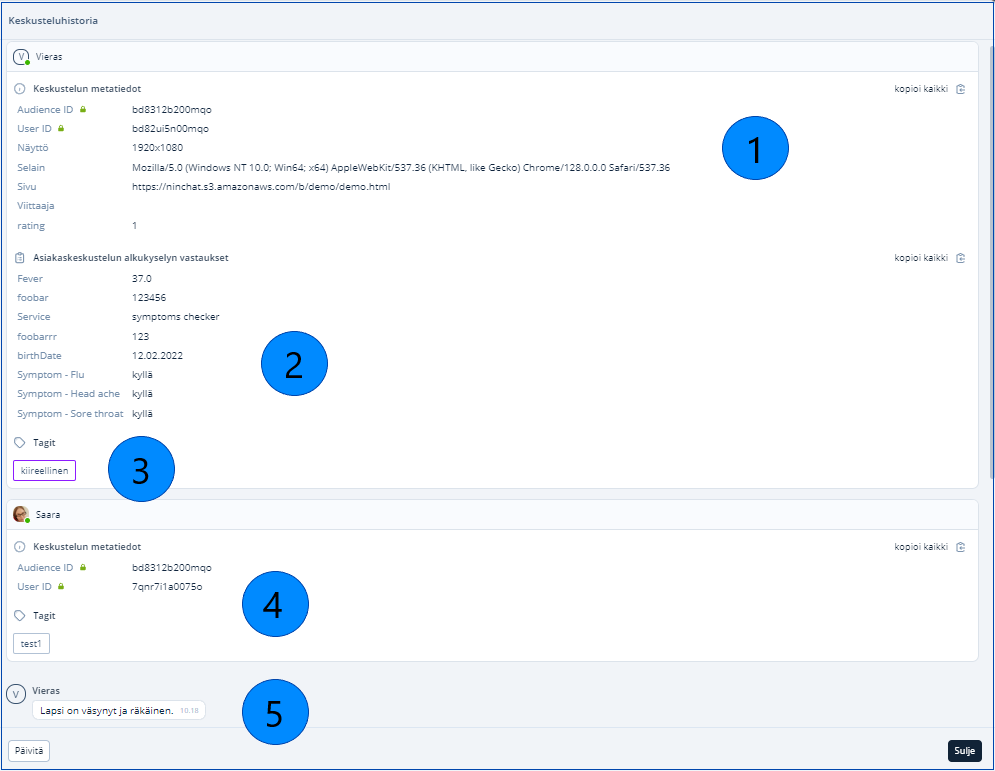
## **Conversation History**

<figure><img src="https://498815019-files.gitbook.io/~/files/v0/b/gitbook-x-prod.appspot.com/o/spaces%2FIeqTSbNtGOeWTiig2G5l%2Fuploads%2Fgit-blob-35eba3739bcafb54e4bef0a04836d13a44a9803d%2FKeskusteluhistoria_tiedot.png?alt=media" alt=""><figcaption></figcaption></figure>

Viewing Conversation History

1. Session and customer information; metadata
2. Customer’s pre questionnaire responses
3. Auto-tags added to the conversation automatically (configured separately)
4. Tags added to the conversation by the specialist
5. Message content and sending time

You can save the conversation to your computer by clicking the "Download CSV" button. The downloaded file can be opened, for example, in Excel. Please ensure data security when exporting information.

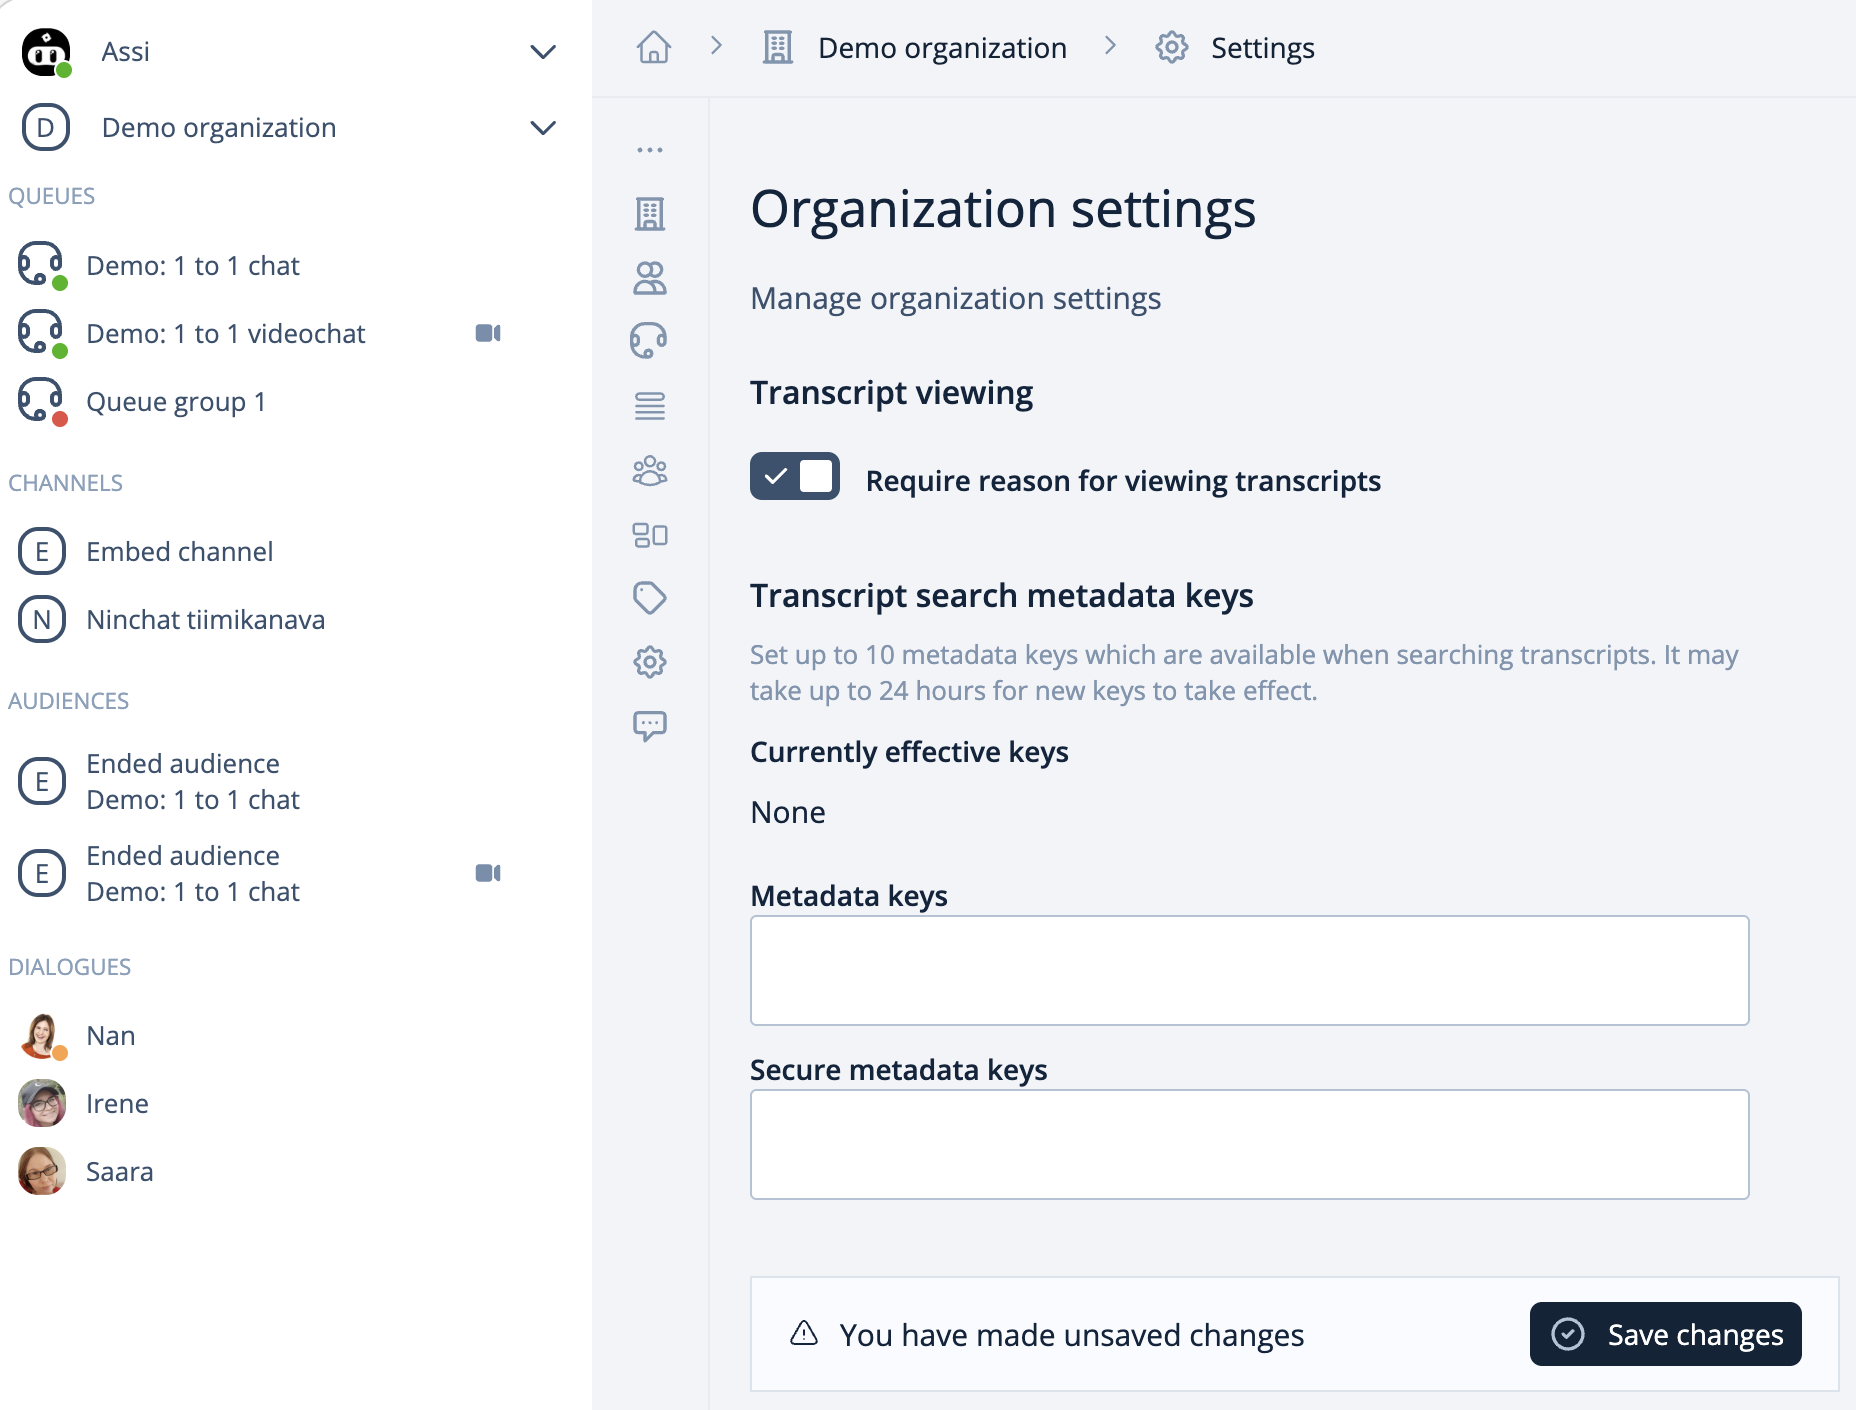
### **Require reason for viewing transcripts**

A reason for viewing conversation history can be required for monitoring purposes. This ensures that conversation history can only be accessed by adding a recorded message.

To enable this feature:

1. Go to Organization settings. You can access these settings by clicking the gear icon.
2. Check the box Require reason for viewing transcripts.
3. Save your changes.

<div data-with-frame="true"><figure><img src="https://498815019-files.gitbook.io/~/files/v0/b/gitbook-x-prod.appspot.com/o/spaces%2FIeqTSbNtGOeWTiig2G5l%2Fuploads%2Fgit-blob-4bbee4aab2f2cd181bd827b59a3e645b99a6a7d4%2Fimage.png?alt=media" alt=""><figcaption><p>Select the setting for the reason to view statistics from the Organization settins view.</p></figcaption></figure></div>

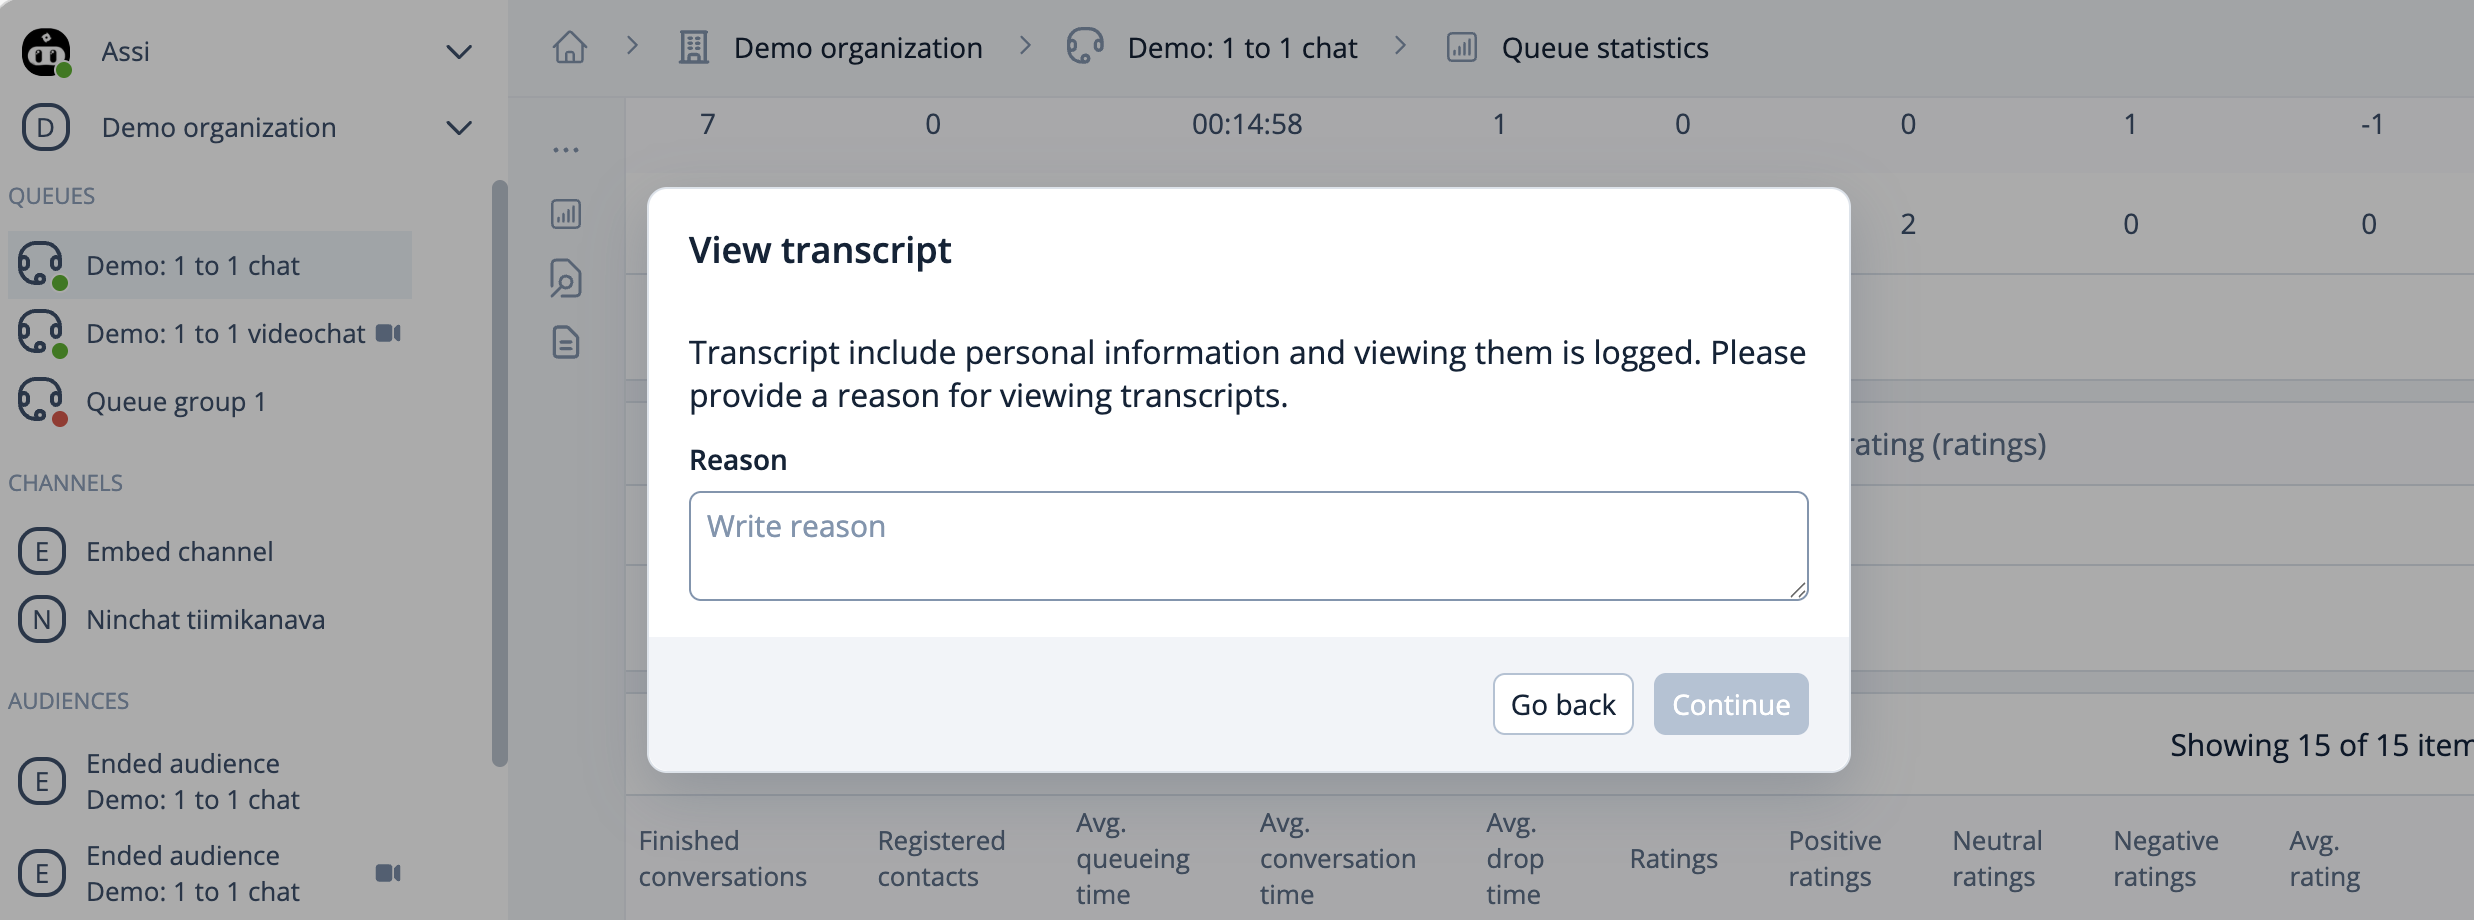
The reason for viewing conversation history is always requested when a person attempts to open a saved conversation. Once the reason is provided, they can access the information. The system keeps a record of who has viewed the data.

<div data-with-frame="true"><figure><img src="https://498815019-files.gitbook.io/~/files/v0/b/gitbook-x-prod.appspot.com/o/spaces%2FIeqTSbNtGOeWTiig2G5l%2Fuploads%2Fgit-blob-f119de330ab411ea0b7feeaccec400da9e29823c%2Fimage.png?alt=media" alt=""><figcaption><p>Recording the reason for viewing a conversation.</p></figcaption></figure></div>

## **How to View Statistics** <a href="#nain-tarkastelet-tilastoja" id="nain-tarkastelet-tilastoja"></a>

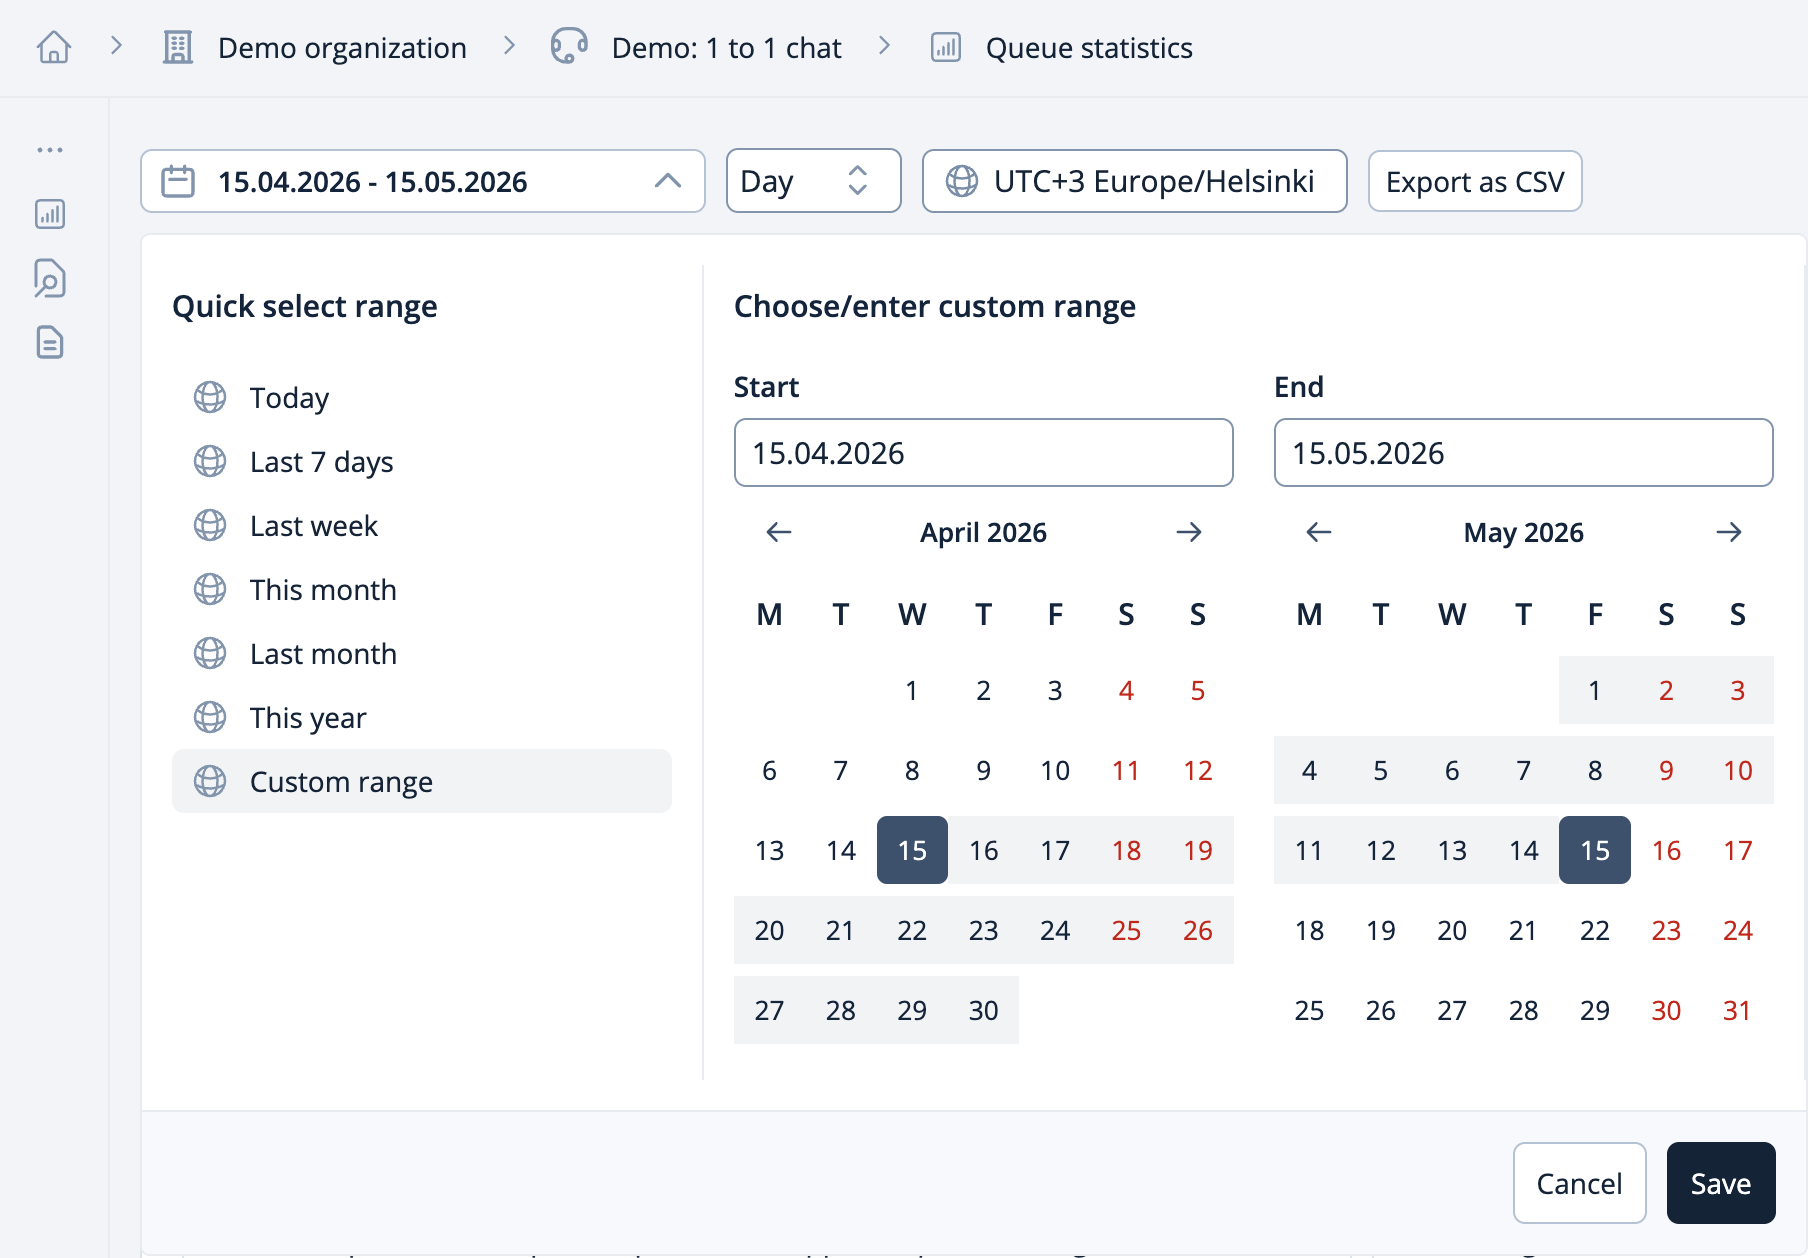
### **Monthly statistics**

How to generate monthly statistics:

1. Select the time range from the "Custom time range" option.
2. Choose one or more months as the desired period.

<div data-with-frame="true"><figure><img src="https://498815019-files.gitbook.io/~/files/v0/b/gitbook-x-prod.appspot.com/o/spaces%2FIeqTSbNtGOeWTiig2G5l%2Fuploads%2Fgit-blob-f5aca11c90636e1cb4d26c01e08d359ea9aac67e%2Fimage.png?alt=media" alt=""><figcaption><p>Selecting range for viewing statistics.</p></figcaption></figure></div>

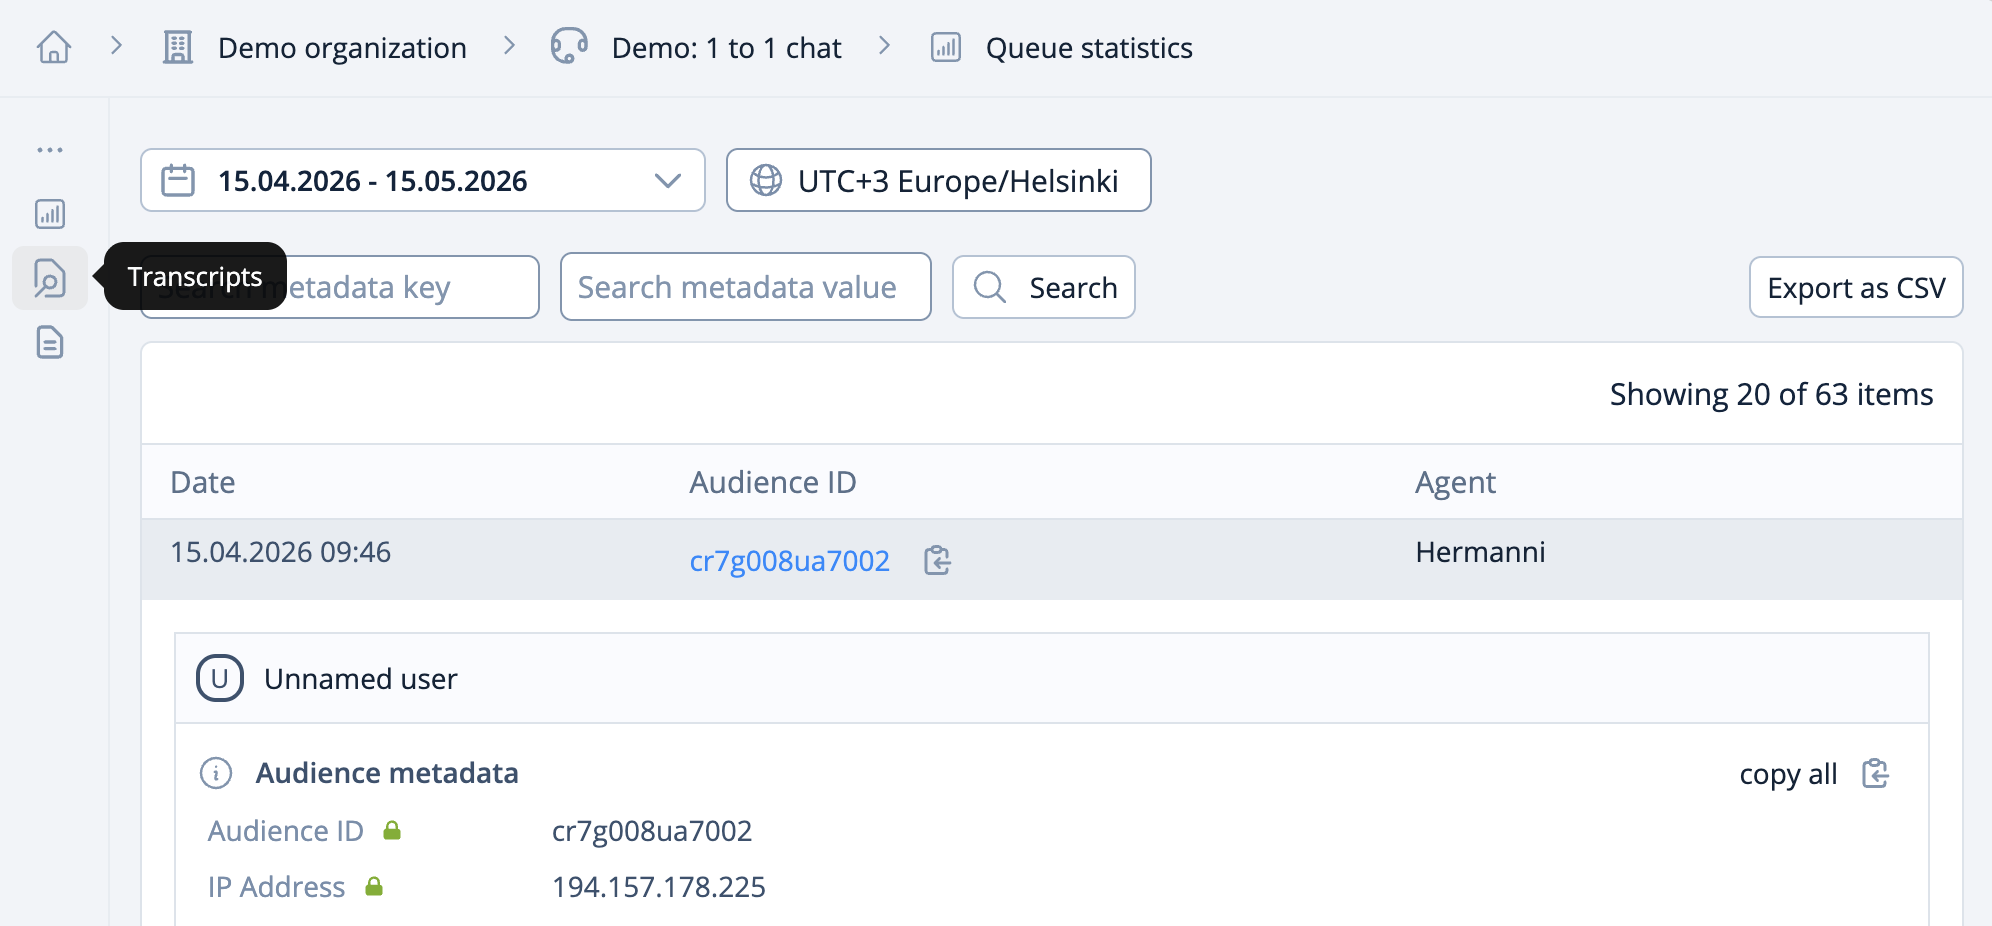
### Searching for conversations

From the 'Queue Statistics' view, you can navigate to the 'Transcripts' view using the vertical menu. In this view, you can select your desired time frame, search for metadata of identified conversations, and download the content of the searched conversations in CSV format.

<div data-with-frame="true"><figure><img src="https://498815019-files.gitbook.io/~/files/v0/b/gitbook-x-prod.appspot.com/o/spaces%2FIeqTSbNtGOeWTiig2G5l%2Fuploads%2Fgit-blob-5887e2f681503d803b69380d51a61c8118f99ed2%2Fimage.png?alt=media" alt=""><figcaption><p>From the vertical menu, you can access the 'Transcripts' view.</p></figcaption></figure></div>

### Questionnaire search

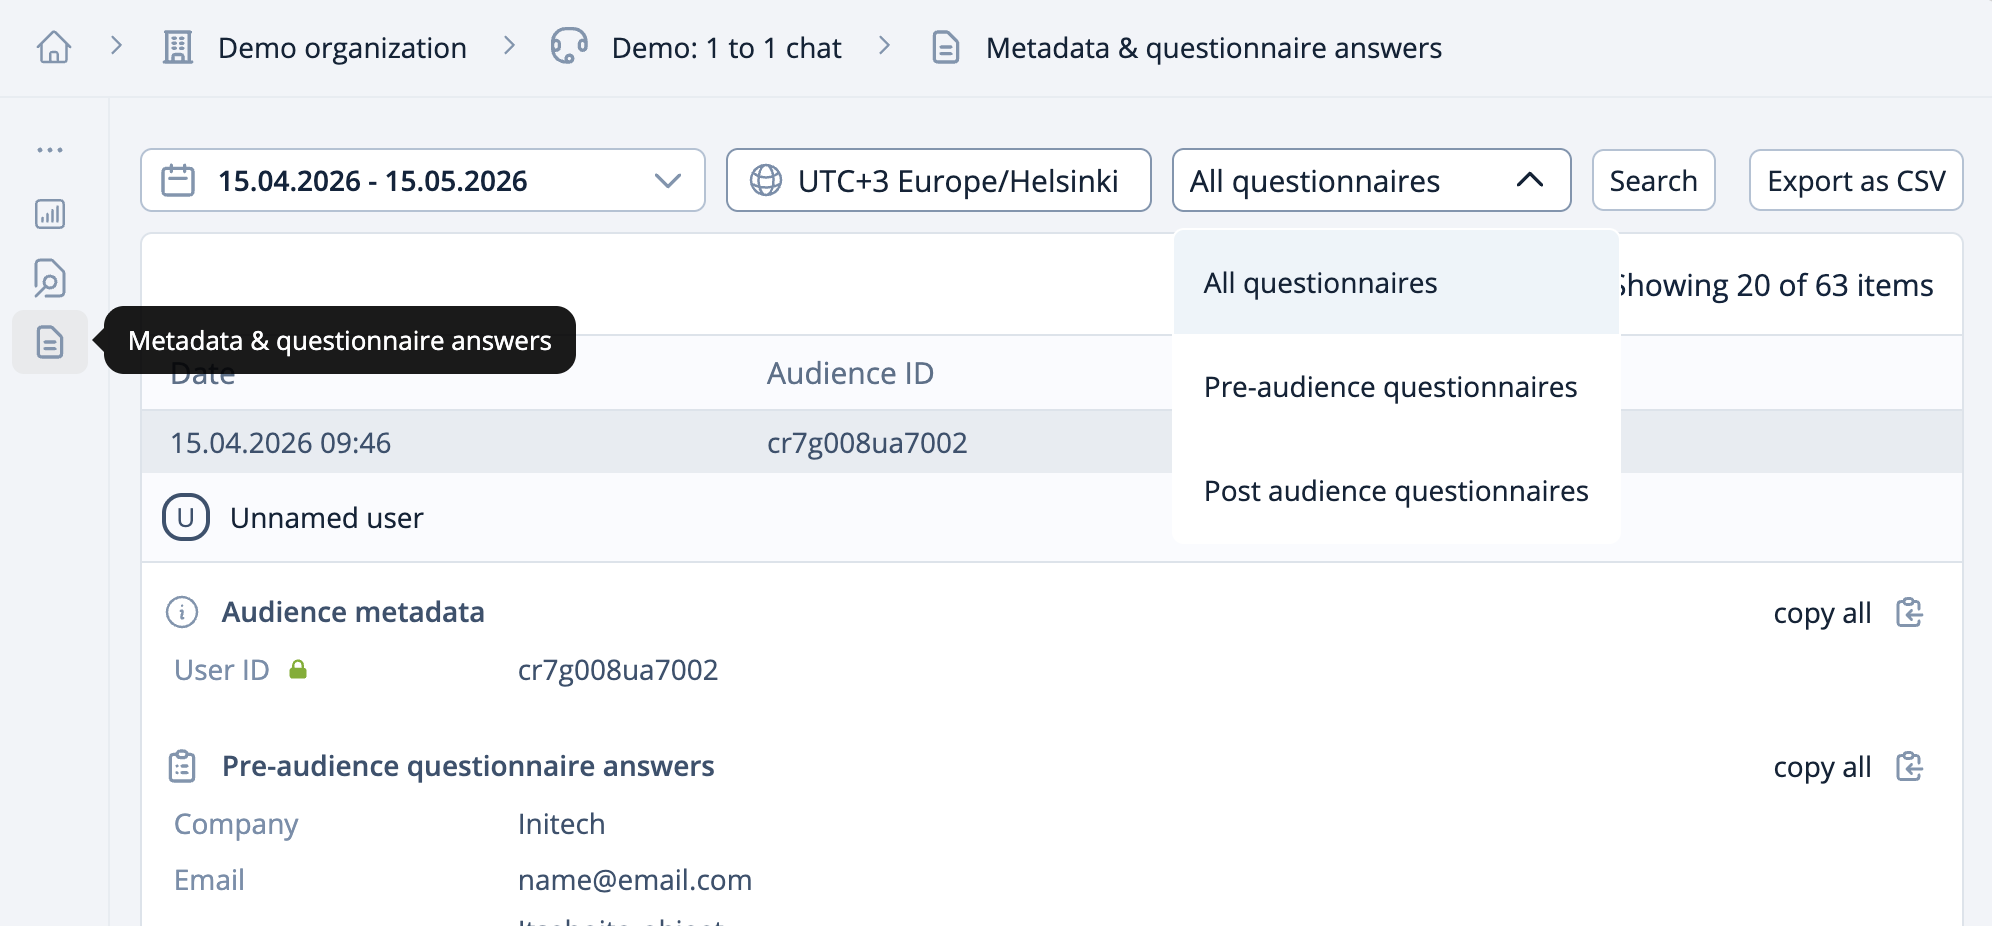
In the 'Metadata & questionnaire answers' view, you can review the responses to surveys. If desired, you can specifically select either all, pre- or post-audience questionnaires for your search.

<div data-with-frame="true"><figure><img src="https://498815019-files.gitbook.io/~/files/v0/b/gitbook-x-prod.appspot.com/o/spaces%2FIeqTSbNtGOeWTiig2G5l%2Fuploads%2Fgit-blob-4613ca5573908bc33c78fa458aa01ddca1bdbf36%2Fimage.png?alt=media" alt=""><figcaption><p>From the 'Metadata &#x26; questionnaire answers' view, you can browse and download the survey responses.</p></figcaption></figure></div>

## Monitoring an Ongoing Conversation

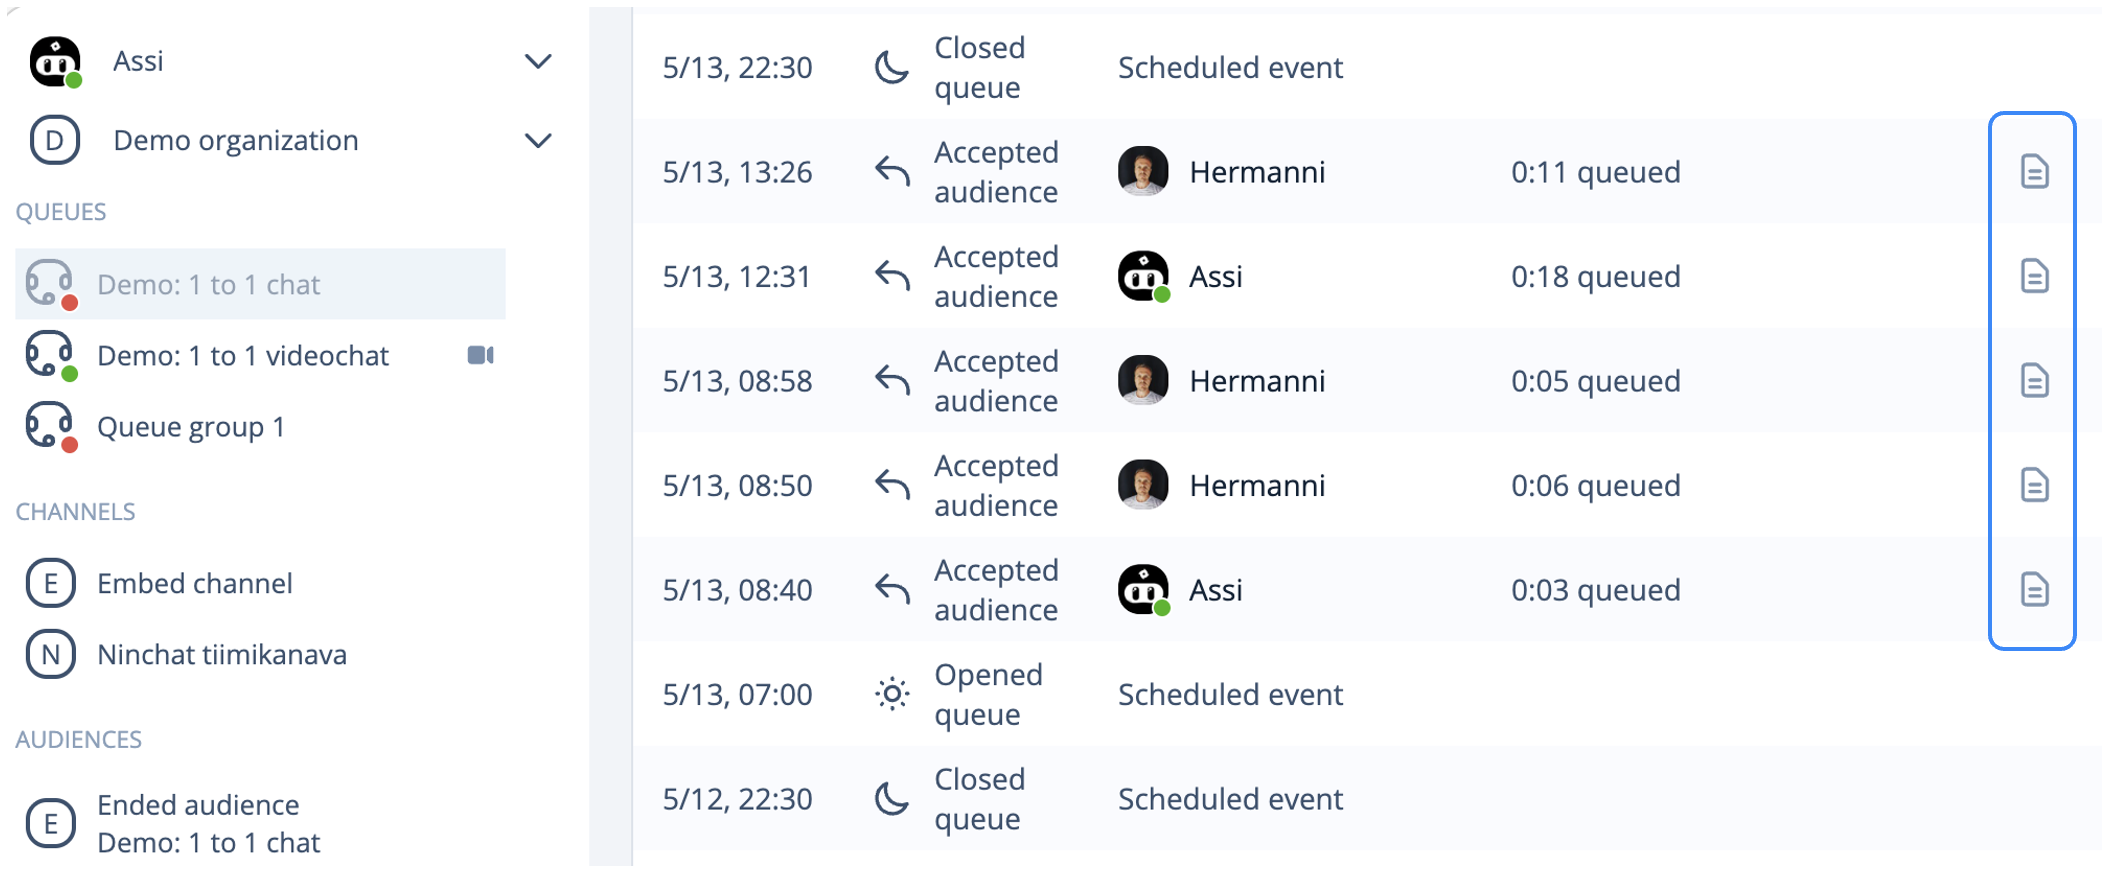
From the Queue activity view, with operator rights you can monitor an ongoing conversation or review the content of a conversation that is already concluded.

<div data-with-frame="true"><figure><img src="https://498815019-files.gitbook.io/~/files/v0/b/gitbook-x-prod.appspot.com/o/spaces%2FIeqTSbNtGOeWTiig2G5l%2Fuploads%2Fgit-blob-e675f25935666ce6fad2892ce9ad0892bd4df935%2Fimage.png?alt=media" alt=""><figcaption></figcaption></figure></div>